.jpg)
Everybody always tells us that saving rainwater is a good thing, and I guess it is from an enviromental point of view. After all, producing good, clean and safe drinking water takes a lot of effort (Dutch) whereas rainwater is free. Also rainwater might actually be better for your plants too, if you live in an area with 'hard' water, and saving rainwater instead of draining it directly to the sewer system diminishes the load on the sewer treatment plants as well.
So it makes sense to install a rainwater butt, a.k.a. a rain catcher, but what amount of rainwater can we expect to collect and what would be a sensible amount to store? After all, these containers cost money too.
In this article we will collect some climate data, estimate some values on evaporation and combine these values with parameters like the volume of the rain container and the area of the roof we collect rain from, to simulate thousands of possible summers to see how much tapwater we can save.
Climate data
Before we even start thinking about collecting rain, we need to know how much rain we get in the area we live in. Most meteorological institutions around the world provide this as open access data, and since I live in the south eastern part of the Netherlands, the KNMI is my go to resource, but navigating raw datasets is not always easy so it might be simpler to look up the data at a commercial weather information provider
Note
In meteorology it is common to talk about millimeters (mm) of rain. This equates to 1 l / m²
If we look at the average chance that it rains on any day during the growth season (April - September) in my area, we get a value of:
Growth season (april - September) Volkel, the Netherlands
| Rain probability: | 39.1% |
| Avg rain (rainy days): | 4.54mm |
This was analyzed for the year 2018 - 2025
Now rain data can vary quite a bit even over small distances and even though I am close to that particular weather station, I compared it to my own measurement data that I collected over the last six years or so on my own amateur weather station.
Growth season (april - September)
| Rain probability: | 41.0% |
| Avg rain (rainy days): | 5.34mm |
So there is a difference, but is it is not huge. In the calculations that follow I'll settle on 40% and 5mm to simulate rainfall.
Gardening & collecting rain
The whole idea of collecting rain water is to use it to water plants in the garden. So we need to have an idea of how often and how much we need to water.
As a gardener I typically start to water the borders if it hasn´t rained for a couple of days in early spring, or every other day in summer or even every day when it is really hot. That is a very roundabout way of saying I am basically guessing how much water has evaporated.
Now we can actually estimate this value (the evapotranspiration) based on the temperature and the incoming solar radiation and those are in fact quantities I measure, or we can again look at the KNMI data and get the averages.
When we do that we see that the evaporation ranges from about 2mm/day in April to just over 4mm/day at the end of June.
So in the model we'll discuss in the next section I start watering if our evaporation deficit gets larger than 10mm. If it does I give the border 'a real good dousing'™ , i.e. I water it until at least some water stays for a short while (4 or 5 seconds) on the soil before draining into it. This equates to about 5mm (as measured with a flow meter in my garden hose)
Note
The evaporation deficit is the cumulative sum of the amount of water that gets onto the soil (via rain or by watering it), minus the amount that evaporates. So after a few dry days, this values gets negative.
Simulating a growth season
Armed with the probability of rain and estimates on the amount of water that will evaporate we can start simulating any number of growth seasons.
That is, based on the average probability it rains on any given day, we can draw a random number between 0 an 1 and use a Bernoulli distribution to determine if it rains today.
Likewise we can use the average amount of rainfall on rainy days to determine how much rain falls. For that we use an exponential distibution
So for every day in the season we determin if it rains and if so, how much, and we keep a running total from which we subtract the evapotranspiration. If this gets below -10mm we add 5mm worth of water.
Garden parameters
With this model of a growth season we can now start simulating what happens in our garden. For that we need a couple of extra parameters:
- The area of the flower borders we need to water.
- The area of the roof we collect water from
- The volume of the water collection container
If the border is larger, we need more water. We'll experiment with a range of values from 25 m² up to 200 m².
The rain you collect has to come from somewhere, in our case one half of a gabled roof with an area of 40 m². We will simulate for some other areas too, and see how this relates to available storage volume.
And that storage volume could be a single rainwater butt of about 250 litres, or perhaps one or more large recycled IBC containers containing 1000l each.
The simulation
- at the beginning of the growth season, all storage is full (we haven´t watered anything during the winter, and there is always plenty of rain)
- every day we
- determine if it rains and calculate $delta = amount - evaporation$
- if it does, we update the rain deficit by adding the delta, also, we add $capture area \times amount$ to the storage, but limit it to the maximum available storage volume
- if it does not rain, we update the rain deficit by adding the delta, also, if the deficit is below -10mm, we lower the stored amount of water by $5 \times irrigation area$ (or less if there is less available in storage) and update the deficit and the storage amount
Every time we use water from storage we add the volume used to the amount of water we saved.
Results
Lets have a look at how varying the collection area and storage volume works out for a watered area of 100 m².
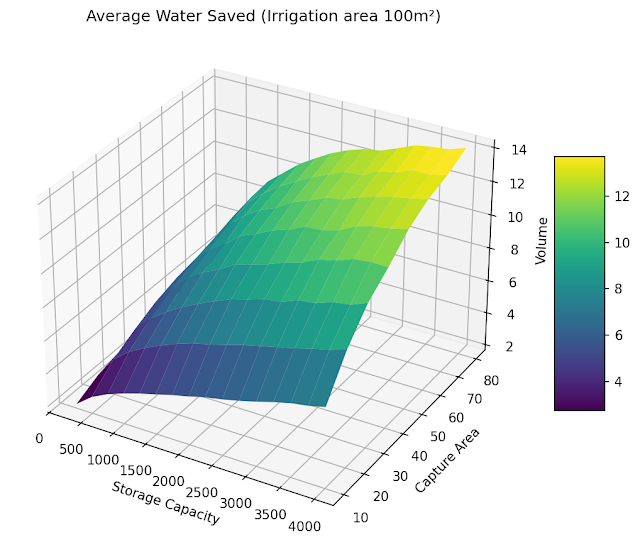
(This image is actually from a live simulation where you can adjust the parameters to see how it works out in your situation. It is available on this page.)
From the graph it is clear that both getting a larger storage volume and increasing the capture increases the amount of water we can save, but there are diminishing returns.
When the storage volume is increased, we initially see a rapid increase in the volume of water that we can save, but with an even larger storage capacity the gain is less. This is especially evident for smaller watered areas and is due to the water storage being completely full at the start of the growth season. The first dry spells can be countered by water from this initial supply but then later in the season it will depend more on what we can collect.
And if the capture area is too small, chances are that we cannot use stored water at some point in time, simply because no matter how large the container, if it isn´t collected, we can´t use it.
The reverse is also true: We can increase the capture area to increase the amount of water we can save, but if the storage volume is too small, any collected water we cannot store simply spills over and will be unavailable to water our plants.
If you play around with the rain probability, you will see that those effects are more pronounced if it rains more often or when rainy days are wetter.
Summary
In my situation, where I have a capture area of around 40 m², a storage volume of 2 m³ and and area to water of about 100 m², the model indicates I will save around 10 m³ per season in our climate.
Increasing the storage volume with another m³ is probably a waste of effort, since it would only save a single extra m³ or so, as tapwater in the Netherlands is around € 2,50 or so, so the € 150,- I paid for two refurbished IBC containers pays itself of in six years, while another container would cost me another € 60 euros at the moment (without transport costs) so would take 25 years to become profitable, or perhaps a little less if tapwater prices (Dutch) increase.
An extra container would pay off if I doubled the capture area, but that is not really an option as the roof space is fixed.
But besides any financial benefits, I am convinced that my current setup is pretty nice, also from an environmental point of view.
Caveats
Keep in mind that this is a model and the results you get are mere indications. As with any model you should be aware that:
-
the model might be wrong
We assume a Bernouilli distribution for rainy days, and an exponential distribution for the amount of rain. This might be different in your area, maybe rainy days are more clustered than the Bernouilli distribution assumes. Also, where I live it rains all year round, so a full reservoir at the start of the season is a reasonable assumption, but this might be different for you. Also using average values for the evapotranspiration is a bit iffy, as it depends on the amount of solar radiation coming in. This might be something to think about in the future and see if that part of the model can be improved.
-
the model code might wrong
Bugs are likely in any bit of non-trivial code, so if you are suspicious, inspect the code! (and let me know via an issue in my GitHub repository)
-
the expected values for rain frequency, amount or evapotranspiration might be wrong
I got mine from my own measurements that I compared with data from our national meteorological institute. I think mine are pretty accurate, but only cover 7 years, while those from the KNMI will be very accurate, and cover 70 years or more, but the nearest observation station is more than 20km as the crow flies and especially rain data can vary quite a bit even over short distances.
-
a model does not predict, it provides likely values only
Using the model we simulate a bunch of scenarios based on average data from the past. That gives us a good idea how things may play out during a number of seasons, but doesn´t predict the next season. Even if it rains on average 700mm every year for the last 50 years, a sudden drought may not reflect those averages at all.
As they say in investment commercials: Results from the past are not a guarantee for the future.
Acknowledgements
The image at the top of the article was from Nguyễn Hữu Nhã on Pexels.
The code for the interactive graph is available from my GitHub repository.